Sigasi CLI is Sigasi’s new command line tool for HDL verification. With it, you can run Sigasi Visual HDL’s powerful verification from the command line. Verification encompasses different aspects, such as syntax checking (is the code syntactically correct?), linting (is there anything suspect in the code?) including semantic checks (do constructs make sense and are they consistent?), and style checking (does the code comply with coding guidelines?).
In this article, we’ll show you how to combine Sigasi CLI and SonarQube or SonarCloud, its SaaS sibling. SonarQube is a tool to monitor code quality. SonarQube can help to keep track of errors, code smells (suspect code), security issues, etc. in your projects. It supports a large number of programming languages, but not Hardware Description Languages (HDL) like VHDL or SystemVerilog. Luckily, SonarQube can import findings from external linters for languages that it doesn’t support. And here’s more good news: Sigasi CLI can be that external linter!
In previous articles, we have demonstrated how to use Sigasi CLI in Continuous Integration (CI) in Jenkins and GitLab CI. We’ll build on what we’ve shown in those articles, modifying the CI pipelines for SonarQube integration. But before we get into the CI integration, we’ll show you how to combine Sigasi CLI and SonarQube on the command line.
Demo Project
For the purpose of this article, a public git repository with a demo
project is available
here . After cloning
the repository, switch to branch
2-report-sigasi-cli-s-findings-in-sonarqube for the SonarQube
demo. E.g.:
git clone https://gitlab.com/sigasi/public/sigasi-cli-ci
git checkout 2-report-sigasi-cli-s-findings-in-sonarqube
You’ll also need to install Sigasi CLI and SonarScanner on your system.
Setting up a SonarQube Project
Setting up a SonarQube project obviously requires that you have access to either a SonarQube server, or to SonarCloud. Running an experimental SonarCloud server can be as simple as pulling and starting a Docker container on a Linux host. Documentation on setting up SonarQube is available here . Once SonarQube is up and running, you can set up a project in SonarQube.
- Select Create new project.
- Give your project a Project key and a Display name and select Set up.
- Under Provide a token, select Generate a token. Give your token a name, select Generate, and click Continue.
Once the project setup in SonarQube is finished, open a terminal
window and cd into the HDL project folder. The demo project
contains a SonarQube configuration file sonar-project.properties
with a few basic settings. Note that you can override these settings
on the command line.
sonar.sources=.
sonar.externalIssuesReportPaths=sigasi-sonar.json
sonar.qualitygate.wait=false
Running Sigasi CLI and SonarQube from the Command Line
Before implementing code verification with Sigasi CLI and SonarQube in CI, it is a good idea to run the CLI-and-SonarQube flow from the command line to check the configuration. Assuming that you have set up the Sigasi CLI license, use these commands to run code verification:
/path/to/sigasi-cli/sigasi-cli verify --sonarqube -o sigasi-sonar.json .
/path/to/sonar/bin/sonar-scanner -Dsonar.projectKey=<my_sonar_project_key> -Dsonar.token=<my_sonar_token> -Dsonar.host.url=<my_sonar_url>
The first command runs Sigasi CLI verification and puts the findings in
sigasi-sonar.json. The second command runs the Sonar scan, which
picks up Sigasi CLI’s findings from the JSON file, and sends them to the
SonarQube server. Use the project key and token, which were generated
in SonarQube during project creation. Note that on Windows, you need
to replace sigasi-cli with sigasi-cli.bat.
After a short while, the results of the scan are available in SonarQube. First, you see an overview of your projects.

Going further, you can check the details of all issues found in the code:

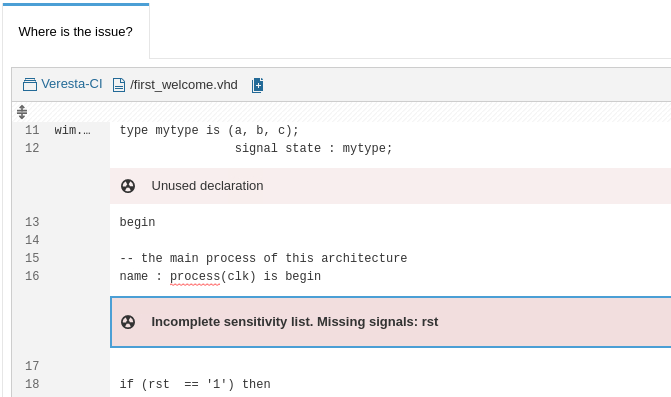
And finally, you can inspect each issue in its context:

Sigasi CLI and SonarQube in GitLab CI
In this section, we extend the demo from our article on Sigasi CLI in
GitLab CI.
The GitLab runners in our setup make
use of Docker containers to run the CI jobs, so we’ll need an extended
container with SonarScanner installed. You can build the container
using the docker/Dockerfile in the GitLab project.
You’ll also want to configure the SonarQube server URL and analysis
token, e.g., by setting the SONAR_HOST_URL and SONAR_TOKEN CI
variables in GitLab. You can also set up the Sigasi CLI
license using GitLab CI
variables.
sigasi-cli-check-sonarqube:
  # Sigasi CLI code check reporting to SonarQube
  #
  # Note that the job succeeds if code validation itself runs
  # successfully, even if the validation reports errors.
  variables:
    # Variables SONAR_HOST_URL and SONAR_TOKEN must be set in GitLab CI
    # After project creation in SonarQube, configure the project key in MY_SONAR_PROJECT_KEY
    SONAR_SCANNER_OPTS: "-server"
    MY_SONAR_PROJECT_KEY: "sigasi-cli-ci-project"
  image:
    name: registry.gitlab.com/sigasi/public/sigasi-cli-ci:sonar.0.1
    pull_policy: if-not-present
  tags:
    - sigasi-cli
  stage: test
  script:
    - sigasi-cli verify --sonarqube . > sigasi-sonar.json
    - sonar-scanner -Dsonar.projectKey=${MY_SONAR_PROJECT_KEY}
When the pipeline has finished, you can check out the result in SonarQube as shown earlier.
Sigasi CLI and SonarQube in Jenkins
In this section, we extend the demo from our article on Sigasi CLI in Jenkins. Good news for Jenkins users: Jenkins has a SonarQube Scanner plugin which we recommend installing.
SonarQube Plugin Setup
The SonarQube plugin requires configuration in Jenkins, which we’ll briefly discuss here.
Main Setup
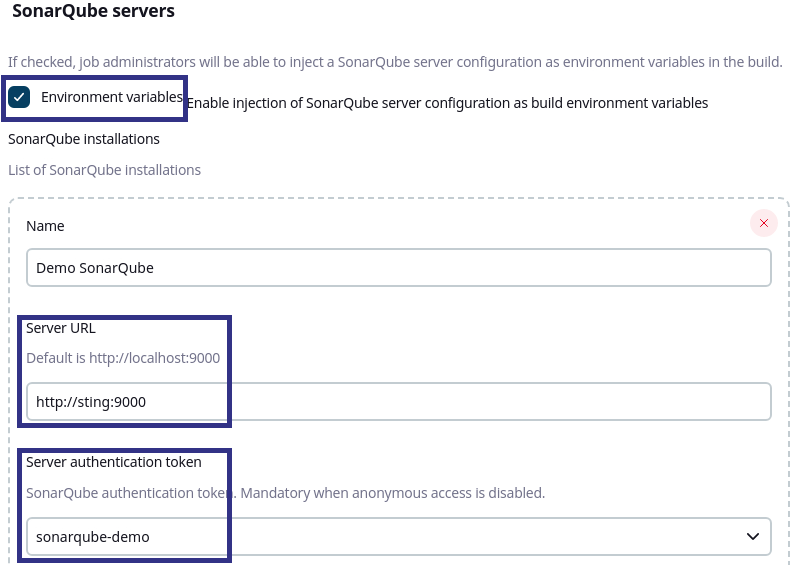
In Jenkins, open the system configuration: . Under SonarQube servers, make sure that Environment variables is checked. Add the Server URL of your server and configure a Server authentication token . Don’t use a project analysis token here as this token will be used for all projects to be analyzed in Jenkins.

SonarQube Scanner Tool Setup
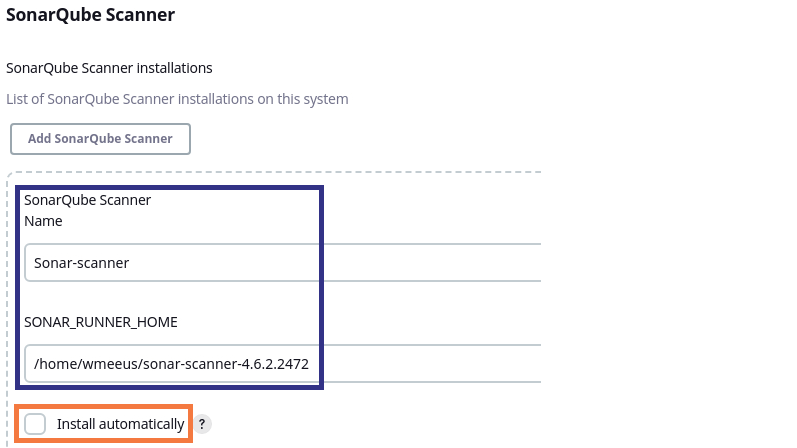
Next, set up the scanner in Jenkins’ global tool configuration: . Add a SonarQube Scanner and enter a name for your scanner installation. Then, if the scanner is already installed on your build executor, enter the install path as well. Alternatively, you can choose to install the scanner automatically when it’s needed.

Configuring SonarQube in the Jenkins Pipeline
Once SonarQube is configured in Jenkins, you can proceed to configure
the CI pipeline in Jenkinsfile. This example uses a declarative
pipeline with two stages. The first stage runs Sigasi CLI and writes its
findings to sigasi-sonar.json. The second stage runs SonarScanner,
which picks up CLI’s findings and reports to the SonarQube server.
String sigasiCLI = '/home/wmeeus/product/sigasi-cli-current/sigasi-cli'
String sonarProjectKey = 'Sigasi-CLI-CI-Jenkins'

pipeline {
    agent 'any'
    environment {
        SIGASI_LM_LICENSE_FILE = '27040@my_license_server'
    }
    stages {
        stage('Sigasi CLI Verify') {
            steps {
                sh "sigasi-cli verify --sonarqube -o sigasi-sonar.json ."
            }
        }
        stage('SonarQube Analysis') {
            steps {
                withSonarQubeEnv('Demo SonarQube') {
                    withEnv(["PATH+SONAR=${tool 'Sonar-scanner'}/bin"]) {
                        sh "sonar-scanner -Dsonar.projectKey=${sonarProjectKey}"
                    }
                }
            }
        }
    }
}
After running the pipeline, you can check out the result in SonarQube as shown before.
Using SonarQube’s Quality Gate
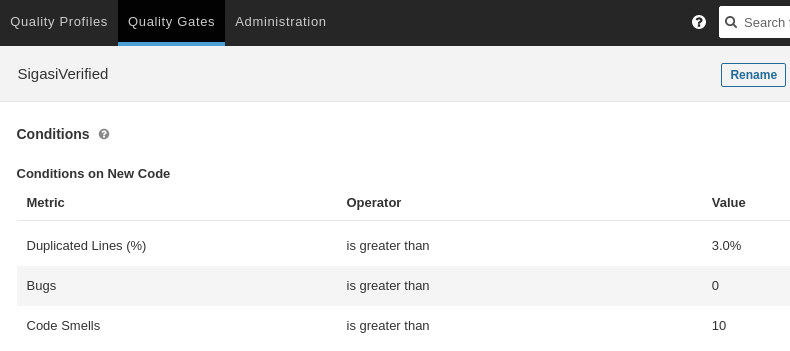
So far, we’ve used SonarQube to analyze and track code quality, but there’s more. SonarQube also has the concept of a Quality Gate, which is an indicator of whether the code complies with your quality standard. For instance, a quality gate could check that the design contains no errors and a maximum number of warnings.
The quality gate is useful in two different ways. Firstly, you can use the quality gate to determine whether your CI pipeline succeeded or failed. A quality gate is a more precise tool than a simple pass/fail check, as it can take many things into account when making a decision: number of warnings, whether these warnings occur in new code, or (with a coverage tool) even test coverage…
Secondly, a quality gate can stop the CI pipeline in the middle if the code doesn’t comply with quality requirements, stopping non-compliant code from being deployed, or avoiding that expensive or time-consuming pipeline stages like RTL synthesis or Place & Route are run.
Most likely, you’ll need to define your own quality gate in SonarQube. Sonar’s default quality gate, Sonar Way, will always fail because it has a coverage requirement—unless you provide coverage data to SonarQube, of course. To resolve that, define your own quality gate in SonarQube, and configure your project to use it. The quality gate will fail if one or more conditions are met.
To enable the quality gate for your project, modify
sonar-project.properties in your project folder to set
sonar.qualitygate.wait to true.
sonar.sources=.
sonar.externalIssuesReportPaths=sigasi-sonar.json
sonar.qualitygate.wait=true

After pushing the updated sonar-project.properties to your
repository, re-run your CI pipeline and check the effect of the
quality gate.
Conclusion
In this article, we have demonstrated how you can integrate Sigasi CLI with SonarQube to monitor the quality of your HDL code. The integration can be implemented easily from the command line or in a CI pipeline in Jenkins or GitLab. Using a quality gate, you can ensure that only quality-compliant code gets deployed into your product.
See also
- Using Sigasi CLI as a Git Commit Hook (knowledge)
- Using Sigasi CLI for HDL Code Verification in GitLab CI (knowledge)
- Using Sigasi CLI in Jenkins CI (knowledge)
- Documentation Generation in CI with Sigasi CLI (knowledge)
- Enabling DO-254 guideline checks in Sigasi SVH (knowledge)